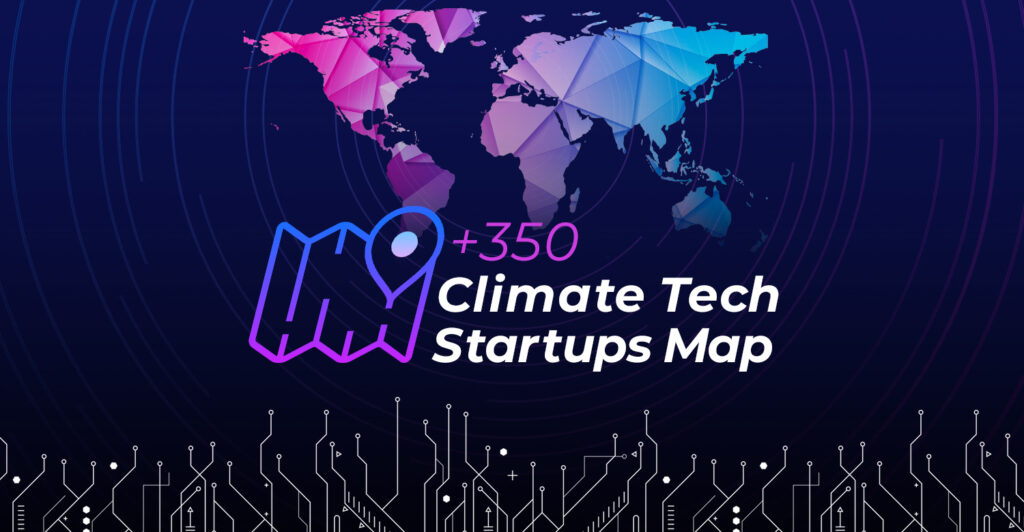

Last quarter, we published Climate Tech Startups Running List Per Emission Sectors to categorize the many startups we have featured on our running list. When we published our list, we began at 200 but have been progressively adding to it and are now up to 350. In an effort to make our climate tech startup data more accessible, we have published this map for you to peruse and explore the startups we have chosen to highlight every week.
What is the running list?
Every week we highlight 5 startups that are making an impact toward tackling climate change. This list was not compiled with any particular methodology, but rather from a series of recommendations or from startup founders who applied to be included. This methodology was by no means scientific, but due to the organic nature in which it was compiled, it may indicate some key trends in the sector. To this list we have also added the startups we have featured as part of our regional series on Africa and India, and our Women in Tech Series.
The running list is available as a database for members and is updated every month. As more startups are added to our list, we will continue to update this page periodically. To view the whole list, click here.
The purpose of this list is to bring visibility to different startups and highlight the various ideas and efforts across the climate sector. We hope that as the sector grows, so too will the Startup Basecamp community and the number of startups we can help get funded and grow.
Using this list of over 350 startups, we have been able to note a few key trends, notably in their geographic and sectoral distributions, which we have examined below.
How well do GHG emissions per sector match startups per sector?
In our running list, we have classified over 350 startups based on the emissions categories they address. These categories are based off of those released by Climate Watch and the World Resources Institute. To these we added two new sectors: Cross-cutting enablers and GHG capture, emissions, and storage.
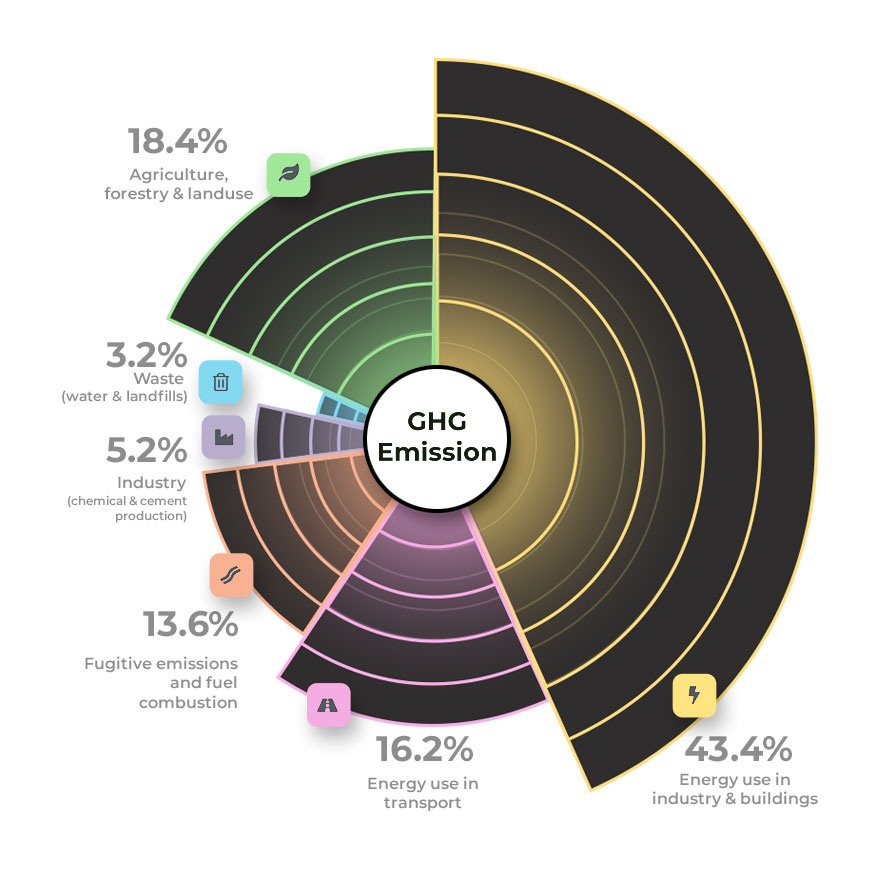
From our startups list, it is clear that the number of startups addressing each sector is not representative of the emissions per sector. There is a high number of startups in energy use in industry and buildings, which fits with the amount of emissions the sector produces. Our list also has a large focus on cross-cutting enablers such as Edutech and Fintech which cover a wide range of emissions sectors. Fugitive emissions, however, account for 13.6% of global emissions, and yet make up less than 1% of the startups on our list. This discrepancy does demonstrate that we need more innovation, if not visibility, in this sector.
How do regional emissions match regional climate tech distribution?
The chart below shows the emissions per region. In the lead is the Asia Pacific region, followed by North America, Europe and the Middle East.
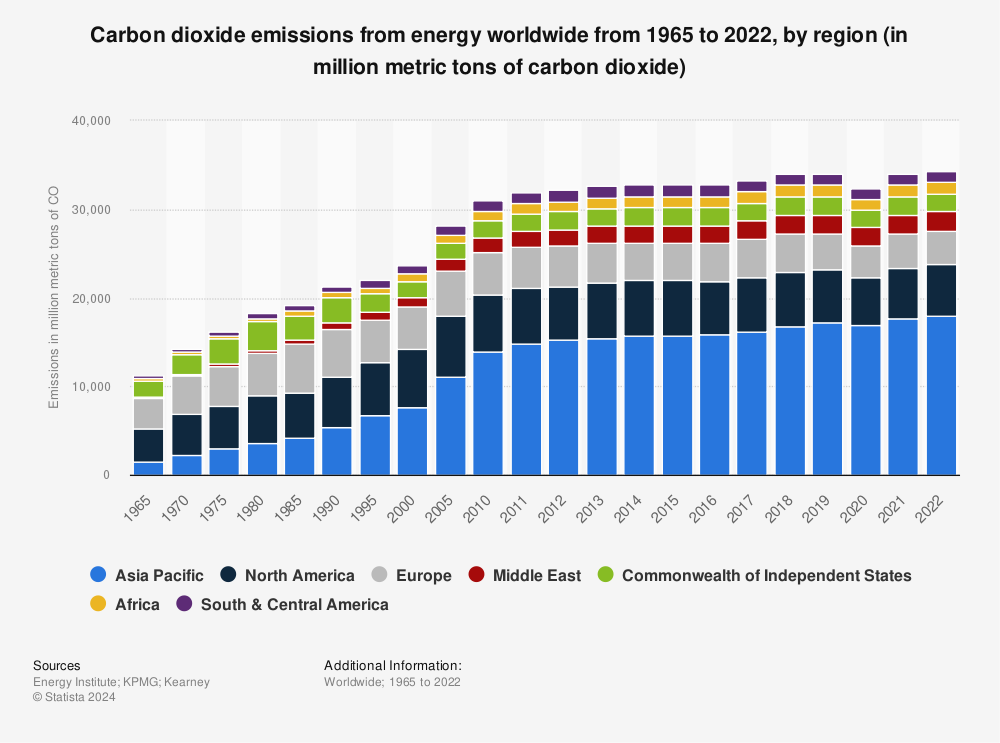
The above graphic shows that most CO2 emissions come from the Asia Pacific region, yet from our list of startups, we only have about 4% located in this region. Our list largely contains startups from Europe and North America, which does match with the next two largest emitting regions.
According to Statistica, 54% of climate tech startup unicorns from 2013-2019 were located in North America. Next was China at 29.5%, with Europe at 9.1% and all other regions combined at 6.8%. Our list, however, shows North America (127 startups) and Europe (157) almost neck and neck with the remaining regions far behind.
Our list does not match this data for two main reasons:
- As an English-speaking startup community, we have an obvious western focus in the startups we choose to highlight.
- This statistic is a bit dated and Europe came a bit later to the climate tech startup game; but it is rapidly catching up.
Yet the clear discrepancy between regional emissions and number of startups in the Asia Pacific region is indicative of the large strides we need to make in promoting, but also funding startups in the Asia Pacific region.
Startup Basecamp is actively looking for startups to fill out the other regions of our map, but until then, we have compiled all of our monthly startups into the map below according to their emissions sector.
How can you help?
There are some key geographic locations that haven’t received much attention. Latin America and Africa stand out, along with south-east Asia. Startup Basecamp recently published a look at 20 startups to watch in Africa and India, which boosted our startup distribution in the area, but the regional representation is still poor. According to the data from Statistica, there are a large number of climate tech startups in China, and yet we only have one. Yet we cannot fix this alone, if you know of any startups in this region, please submit to our list.
These regional voids are also indicative of a greater problem. Can we really say that there aren’t any start-ups in Latin America? Of course not! It’s just that they haven’t gotten the visibility! However, it’s not just us. Aside for HolonIQ’s list of 50 Startups in Latin America, a cursory Google search doesn’t turn up much. These regions, and Latin America, in particular, don’t seem to get as much attention.
So help us please, if you know of any startups in regions ill-represented on this map, SUBMIT TO OUR LIST!
Want to learn more about this map and the startups featured?
Each company on the map has been featured in one of our weekly blogs. If you want to know more about a specific company, you can click on the marker and find the Startup Basecamp blog in which it is featured. These blogs can be found on our blog page.
We've also been working to provide a more in depth look at some key regions...


So far, we have covered Africa and India. Do you know a lot about the climate tech landscape of another region we can feature? Write for us!